Understand the Dashboard
The Dashboard is the home page of the ORBSIS Operations Platform. It provides a quick overview of customers, funds, budgets, and business trends across the platform.
Operations users can use the Dashboard to assess platform scale, funding status, and recent business activity before navigating to the corresponding module for detailed data.
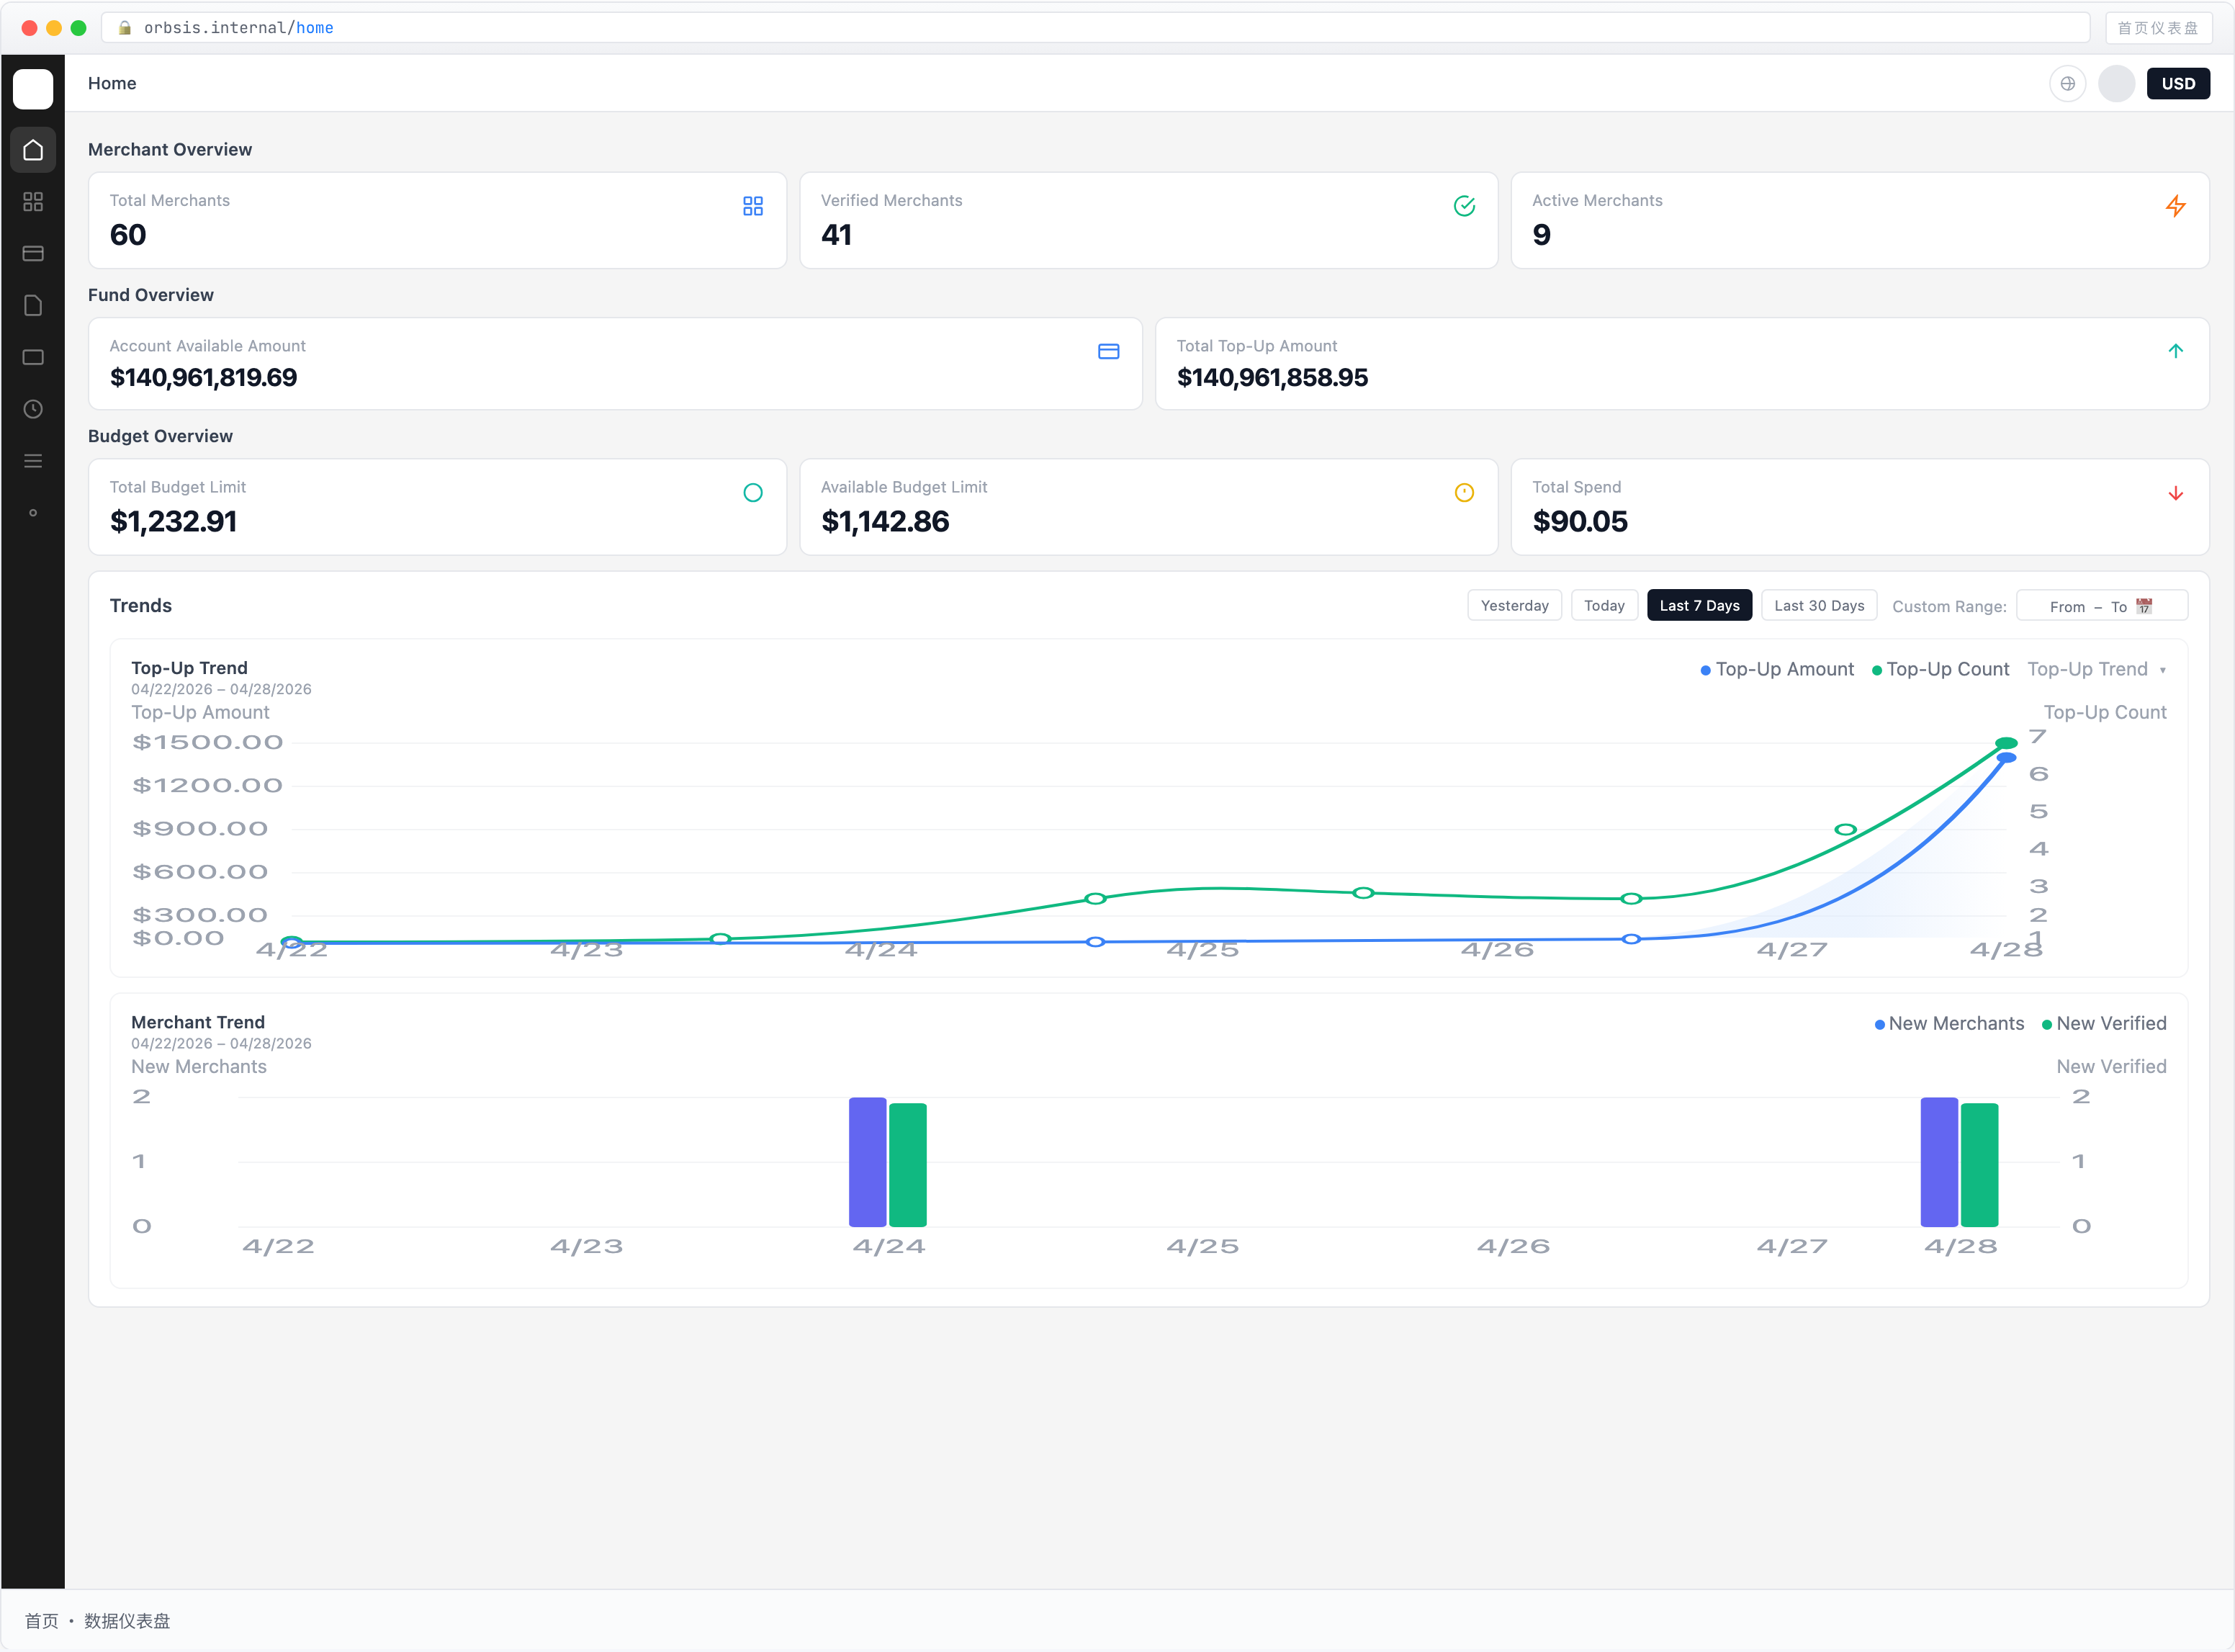
Customer Overview
| Field | Description |
|---|---|
| Total Merchants | Total number of registered entities on the platform across all business statuses |
| Verified Merchants | Number of entities that have completed and passed KYC / KYB verification |
| Active Merchants | Number of entities with at least one valid transaction or top-up during the selected period |
Total Merchants
Shows the total number of entities currently registered on the platform.
This metric can be used to monitor overall customer scale.
Verified Merchants
Shows the number of entities that have completed and passed KYC / KYB verification.
Verified entities can open accounts and use the relevant platform capabilities according to platform rules.
Active Merchants
Shows the number of entities with at least one valid business activity during the selected period.
Common activities include:
- Top-ups
- Fund transfers
- VCC transactions
Funds Overview
| Field | Description |
|---|---|
| Account Available Amount | Aggregate available funds across primary accounts and sub accounts that can currently be freely allocated |
| Total Top-Up Amount | Total amount of successfully credited top-ups on the platform |
Account Available Amount
Account Available Amount reflects the amount of funds currently available for free allocation across the platform.
For sub accounts:
Available Balance excludes amounts already allocated to budgets and excludes Frozen Amount.
This field should therefore not be confused with budget-level Available to Spend or Available Limit.
Total Top-Up Amount
Shows the total amount of top-ups that have been successfully credited to the platform.
Only completed top-up records are included in this metric.
Budget Overview
| Field | Description |
|---|---|
| Total Budget Limit | Aggregate Budget Limit across all budgets on the platform |
| Available Budget Limit | Aggregate Available Limit across all budgets on the platform |
| Total Spent | Aggregate amount spent across budgets or VCC cards |
Total Budget Limit
Total Budget Limit = Sum of the Budget Limit of all budgets
This represents the total amount currently configured across all budgets on the platform.
Available Budget Limit
Available Budget Limit reflects the amount that can still be allocated or used by shared cards.
For an individual budget:
Available Limit = Budget Limit − Utilized Limit
The Dashboard displays the aggregate Available Limit across all budgets.
Available Budget Limit is not the same as Available to Spend.
- Available Limit answers: How much can still be allocated or used by shared cards?
- Available to Spend answers: How much of the allocated budget has not yet been actually spent?
Total Spent
Total Spent reflects the actual spending volume generated by VCC cards on the platform.
Under the current documentation model, Total Spent includes transactions in Processing and Successful status.
Refunds, reversals, and other reverse transactions update the relevant spending data according to the final transaction result.
Trends
The Dashboard provides business trend charts that can be filtered by time range.
Top-Up Trend
The Top-Up Trend shows the following metrics for the selected period:
- Top-Up Amount
- Top-Up Count
Top-Up Amount reflects the scale of fund inflows, while Top-Up Count reflects top-up frequency.
Merchant Trend
The Merchant Trend shows:
- New Merchants
- New Verified
These metrics can be used to monitor customer growth and verification progress.
Time Range
Trend charts support the following time ranges:
| Option | Description |
|---|---|
| Yesterday | Yesterday |
| Today | Today |
| Last 7 Days | Previous 7 days |
| Last 30 Days | Previous 30 days |
| Custom Range | Custom date range |
When the time range changes, trend data is recalculated for the selected period.